From "You Have a Bug" to "Here's the Root Cause" — Adding AI Code Analysis to My App Review Pipeline
TL;DR: I built an app review pipeline that classifies bugs and crashes. It was useful but stopped at "what's wrong." I extended it to answer "where in the code" and "what to change" — using a PydanticAI agent with codebase exploration tools, then made the analysis engine pluggable so it can use Grok Build, Claude Code, or OpenAI Codex as backends. Here's how I got there, what broke along the way, and how the architecture ended up.
Where I Started
I have a CLI tool called AppPulse that monitors my app's reviews and crash data. Every morning it:
- Pulls new reviews from Google Play / App Store
- Classifies each one with an LLM — bug, crash, feature request, performance, praise
- Correlates reviews with crash data from Sentry/Firebase
- Sends me a digest
apppulse run
# → "12 new reviews: 3 bugs (1 critical), 2 feature requests, 7 praise"
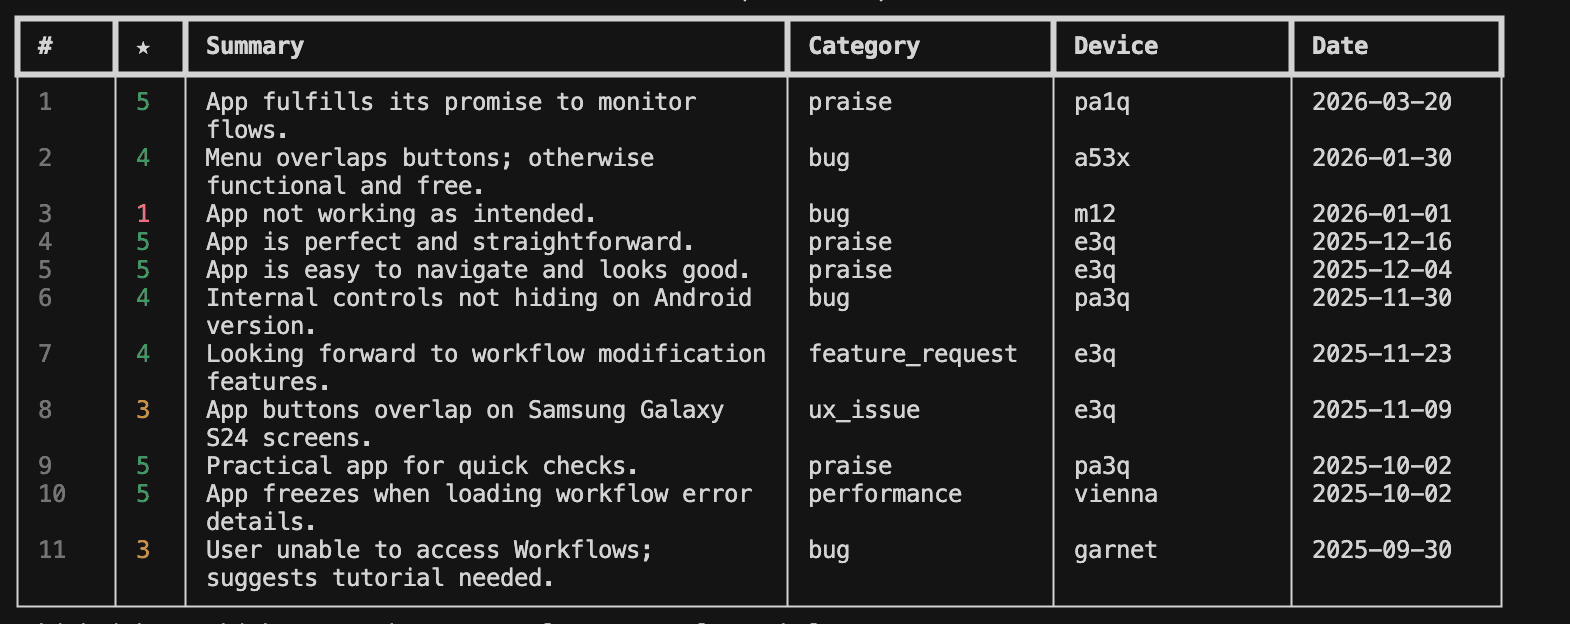
apppulse reviews --category bug
# ID │ Rating │ Summary │ Severity
# 42 │ ★☆☆☆☆ │ Photo upload crashes for >10MB images │ critical
This was genuinely useful. I knew what users were complaining about and which crashes were affecting the most people. But the pipeline stopped at classification. When I saw "Photo upload crashes for >10MB images," I still had to:
- Open the project in my IDE
- Search for upload-related code
- Cross-reference the stacktrace from Sentry
- Mentally map the review to the actual code
- Figure out what to change
For one bug, that's fine. For a batch of 5 critical bugs on a Monday morning, it's a lot of manual work before I've even started fixing anything.
I wanted the pipeline to go further — to take the classified review, point to the specific files and lines causing the issue, and hand me a brief I could act on immediately.
The First Version: A PydanticAI Agent with Codebase Tools
The core idea was simple: give an LLM agent access to my codebase through read-only tools and let it investigate the bug, just like I would.
Why PydanticAI
I considered LangGraph, LangChain, and rolling my own agent loop. PydanticAI won for three reasons:
- Structured output by default. I needed the analysis to come back as a validated Pydantic model — not free-form text I'd have to parse. PydanticAI auto-validates the LLM output against the schema and retries with correction instructions if it's wrong.
- Minimal dependency footprint. AppPulse is a lightweight CLI. I didn't want to drag in LangChain's dependency tree for a single-agent linear workflow.
- It already supports the LLM providers I use — OpenAI, Anthropic, Ollama. No new API keys.
The Output Model
Every analysis produces a validated AnalysisBrief:
class AnalysisBrief(BaseModel):
    issue_type: str              # bug | crash | feature_request
    summary: str                 # one-paragraph assessment
    root_cause: str | None       # for bugs/crashes
    feature_rationale: str | None # for feature requests
    affected_files: list[AffectedFile]
    proposed_changes: list[ProposedChange]
    complexity: str              # small | medium | large
    risks: list[str]             # potential side effects
    testing_notes: str           # what tests to write/update
This is the contract between the analysis engine and the rest of the pipeline. Whether the analysis runs in-process or via an external coding agent, it always produces the same structure.
Four Built-in Tools
The agent gets four tools — all read-only, all operating on the local codebase:
@analysis_agent.tool
async def tool_search_code(ctx: RunContext[AnalysisDeps], keyword: str, file_extensions: str = "") -> str:
    """grep/ripgrep search — finds where relevant code lives."""
    return search_code(ctx.deps.code_path, keyword, file_extensions)

@analysis_agent.tool
async def tool_read_file(ctx: RunContext[AnalysisDeps], file_path: str, start_line: int = 0, end_line: int = 0) -> str:
    """Read source with line range, capped at 500 lines, path-validated."""
    return read_file(ctx.deps.code_path, file_path, start_line, end_line)

@analysis_agent.tool
async def tool_list_files(ctx: RunContext[AnalysisDeps], directory: str = ".", pattern: str = "") -> str:
    """Directory listing with sizes."""
    return list_files(ctx.deps.code_path, directory, pattern)

@analysis_agent.tool
async def tool_find_symbols(ctx: RunContext[AnalysisDeps], name: str) -> str:
    """Regex-based definition search — classes, functions, methods."""
    return find_symbols(ctx.deps.code_path, name)
Every tool validates paths against code_path to prevent directory traversal — no ../../etc/passwd games. The agent can explore but never escape the project root.
The Problem with V1: Too Many API Calls
The first version worked, but the agent was expensive. It would make 40-50 tool calls — listing directories, searching for broad terms, reading entire files — before settling on a hypothesis. At gpt-4o-mini rates that's still cheap, but it hit the API request limit I'd set and sometimes never produced output.
Optimization 1: The Repo Map
The biggest waste was the agent discovering project structure. It would call list_files recursively, trying to understand where things lived before it could even start investigating.
The fix: generate a repo map upfront and include it in the system prompt. The repo map is a compact text overview of every source file with its top-level symbols (classes, functions) extracted via regex:
src/services/
  ImageUploadService.java — ImageUploadService, compress, validateSize, uploadToS3
  UserService.java — UserService, getProfile, updatePreferences
src/utils/
  ImageUtils.java — ImageUtils, downscale, getExifOrientation
This gives the agent a "GPS" before it makes any tool calls. Instead of blindly listing directories, it can read the repo map and go straight to ImageUploadService.java when investigating an upload crash.
Caching the Repo Map
Generating the repo map means walking the entire source tree and reading every file for definitions. For a medium project (~500 files), that's 100-500ms. Fine for a one-off, but I didn't want to pay that cost on every analysis.
The cache strategy uses a git-based fingerprint:
def _compute_fingerprint(root: Path) -> str:
    # Git repos: HEAD commit + dirty-file count (~5ms)
    head = subprocess.run(["git", "rev-parse", "HEAD"], ...)
    status = subprocess.run(["git", "status", "--porcelain"], ...)
    dirty_count = len(status.stdout.strip().splitlines())
    return hashlib.sha256(f"{commit}:{dirty_count}".encode()).hexdigest()[:16]
Cache hit: ~0ms. Cache miss (new commit or uncommitted changes): regenerate. The cache self-invalidates on every git operation that changes the working tree.
Optimization 2: Progressive Tool Gating
Even with the repo map, the agent would sometimes keep exploring forever — finding tangential files, searching for related patterns, going down rabbit holes. Sound familiar? It's what I do when debugging at 2am.
The fix is a funnel that progressively restricts the agent's tools:
async def _prepare_tools(ctx: RunContext[AnalysisDeps], tool_defs: list[ToolDefinition]):
    tool_call_count = count_tool_calls(ctx.messages)

    if tool_call_count >= 18:
        return []           # No tools — force the agent to produce output

    if tool_call_count >= 12:
        # Only read_file — no more searching, refine what you already found
        return [td for td in tool_defs if td.name not in EXPLORATION_TOOLS]

    return tool_defs        # Full access during exploration phase
| Phase | Tool Calls | Available Tools |
|---|---|---|
| Exploration | 0-12 | All 4 tools |
| Deep-dive | 12-18 | read_file only |
| Forced output | 18+ | None |
This dropped the average analysis from 40+ tool calls to 8-12, with no noticeable quality difference. The agent just gets to the point faster.
The Bigger Step: Pluggable Analysis Backends
The in-process PydanticAI agent worked well for straightforward bugs. But for complex, multi-file issues — or when I wanted deeper analysis — I kept wishing I could point a full coding agent like Grok Build or Claude Code at the codebase and just get back a structured brief.
All of these tools support headless mode:
# Grok Build
grok -p "analyze this bug..." --cwd /path/to/code --tools "read_file,grep,list_dir" --yolo

# Claude Code
claude -p "analyze this bug..." --cwd /path/to/code --dangerously-skip-permissions

# OpenAI Codex
codex --quiet --approval-mode full-auto "analyze this bug..."
The challenge: each agent returns its output differently (JSON, plain text, structured conversations), and I still needed a validated AnalysisBrief at the end.
The Two-Stage Pipeline
The solution is a two-stage pipeline for external backends:
Stage 1: Coding Agent → Raw Markdown
Stage 2: Cheap LLM (structurer) → Validated AnalysisBrief
Stage 1 runs the coding agent with a prompt that asks it to produce a markdown analysis with specific sections (Summary, Root Cause, Affected Files, Proposed Changes, etc.). The agent uses its own tools to explore the codebase — it's much better at this than my four built-in tools because it has full access to grep, file reading, and code understanding.
Stage 2 is a single, cheap gpt-4o-mini call that extracts the markdown into the AnalysisBrief Pydantic model. No tools, no exploration — just structured extraction. Costs fractions of a cent.
The raw markdown from Stage 1 is saved as an inspectable artifact at ~/.apppulse/analyses/raw/. If the structured output looks wrong, I can check exactly what the coding agent found.
The Backend Architecture
I wanted to be able to add new backends without touching the core analysis flow. The architecture uses a lazy-loaded registry with a strategy pattern:
# backends/__init__.py
BACKEND_REGISTRY: dict[str, str] = {
    "builtin":     "apppulse.code_analysis.backends.builtin:BuiltinBackend",
    "grok":        "apppulse.code_analysis.backends.grok:GrokBackend",
    "claude_code": "apppulse.code_analysis.backends.claude_code:ClaudeCodeBackend",
    "codex":       "apppulse.code_analysis.backends.codex:CodexBackend",
}

def get_backend(name: str) -> BaseAnalysisBackend:
    module_path, class_name = BACKEND_REGISTRY[name].rsplit(":", 1)
    module = importlib.import_module(module_path)
    return getattr(module, class_name)()
Backends are imported lazily — if you never use Grok, grok.py is never loaded. Adding a new backend is three steps:
- Create a module that subclasses
ExternalAgentBackend - Implement
_build_command()— return the argv list - Add one line to
BACKEND_REGISTRY
Here's the entire Grok backend:
class GrokBackend(ExternalAgentBackend):
    name = "grok"
    display_name = "Grok Build"
    cli_command = "grok"

    def _build_command(self, prompt, cwd, max_turns):
        return [
            "grok", "-p", prompt,
            "--cwd", cwd,
            "--tools", "read_file,grep,list_dir",   # read-only
            "--yolo",
            "--output-format", "json",
            "--max-turns", str(max_turns),
        ]
Everything else — prompt assembly, subprocess management, output parsing, raw artifact saving, and the Stage 2 structurer call — is handled by the ExternalAgentBackend base class. The concrete backend only knows how to build its CLI command.
Switching Backends
In config.yaml:
code_analysis:
  enabled: true
  backend: "grok"        # swap to "builtin", "claude_code", or "codex"
  max_turns: 15           # how many exploration turns for external agents
The setup wizard auto-detects which CLIs are installed on your PATH and lets you pick:
Available analysis backends:
  1. builtin     — Built-in (PydanticAI) — lightweight, no extra tools needed
  2. grok        — Grok Build — headless mode, read-only tool access
  3. claude_code — Claude Code — deep exploration, 200K context
Choose a backend [1]:
What the Output Looks Like
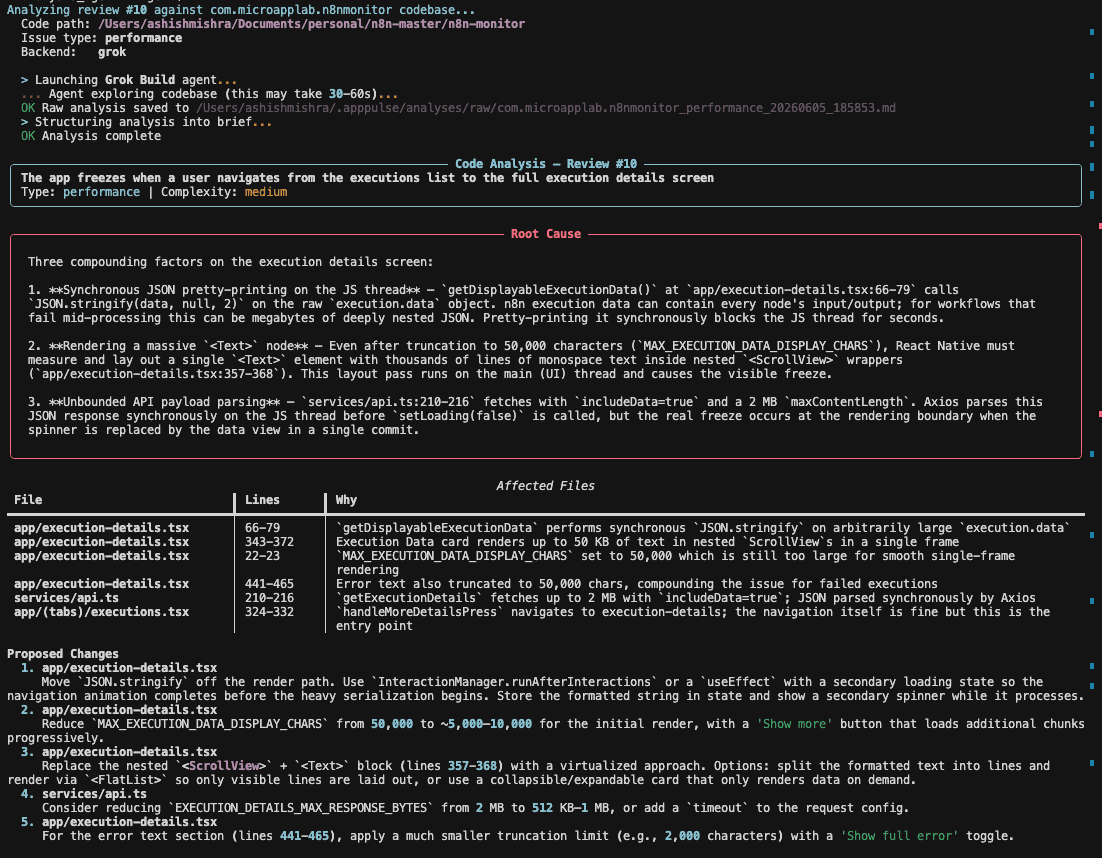
Whether using the builtin or an external backend, the output is the same validated structure:
$ apppulse analyze 42

Analyzing review #42 against MyApp Android codebase...
  Code path: /Users/me/projects/myapp
  Issue type: bug
  Backend:   grok

  > Launching Grok Build agent...
  ... Agent exploring codebase (this may take 30-60s)...
  OK Raw analysis saved to ~/.apppulse/analyses/raw/MyApp_bug_20250710_091523.md
  > Structuring analysis into brief...
  OK Analysis complete

┌──────────────────────────────────────────────────────────────┐
│  CODE ANALYSIS — Review #42                                   │
│  Photo upload crashes for >10MB images                        │
│  Type: bug │ Complexity: medium                               │
├──────────────────────────────────────────────────────────────┤
│  ROOT CAUSE                                                   │
│  ImageUploadService.compress() loads the full bitmap into     │
│  memory before compression. Images >10MB exceed the heap      │
│  limit on devices with ≤4GB RAM → OutOfMemoryError.           │
│                                                               │
│  AFFECTED FILES                                               │
│  ImageUploadService.java (lines 45-89) — compress() method    │
│  ImageUtils.java (lines 12-35) — no input size validation     │
│                                                               │
│  PROPOSED CHANGES                                             │
│  1. Add BitmapFactory.Options.inSampleSize for downsampling   │
│  2. Add file size validation before compress()                │
│  3. Use streaming compression instead of in-memory byte array │
│                                                               │
│  RISKS                                                        │
│  • Downsampling reduces image quality for server-side use     │
│  • Need to test across API levels 26-34                       │
└──────────────────────────────────────────────────────────────┘
With --output file, it saves the analysis as markdown with a ready-to-paste prompt section at the bottom — hand it directly to a coding agent to implement the fix.
Watch Out For
Config nesting. The
code_analysisblock goes at the top level of your config YAML, not nested under an app entry. I made this mistake myself — the parser readscode_analysisfrom the root, so nesting it underapps[]means it silently gets ignored and falls back to defaults.prepare_toolsis called every turn. It receives the full message history, so counting tool calls is O(n) over all messages. For 25 turns this is negligible, but if you remove the request limit, it could get slow on very long conversations.External agent stdout formats vary. Claude Code with
--output-format jsonwraps its response in a JSON object; Codex prints plain text. TheExternalAgentBackend._extract_text()method handles both, but if you add a new backend, check what it actually writes to stdout.Model name prefix matters. PydanticAI wants
openai-chat:gpt-4o-mini(not justgpt-4o-mini). Without the prefix, you get a deprecation warning and potentially the wrong provider.
What I'm Thinking About Next
This pipeline keeps evolving. Some things on the radar:
- Per-app backend config. Right now
code_analysisis global. If you have multiple apps, you might want Grok for one and builtin for another. The config structure needs to support this. - Batch analysis.
apppulse analyze --category bug --severity criticalto analyze all critical bugs in one run instead of one-by-one. - Analysis history. Tracking which analyses led to successful fixes — creating a feedback loop that improves future analysis quality.
- Auto-analyze in pipeline. Option to run analysis on all critical bugs during
apppulse run, so the morning digest includes code-level briefs, not just classification.
Takeaways
- Start with classification, then add analysis. Getting reviews categorized (bug vs. feature request vs. praise) is the foundation. Code analysis is the layer on top — it's valuable but depends on good classification first.
- Give the agent a map before tools. The repo map cut tool calls by 60%. An LLM exploring a codebase blind will waste most of its budget on orientation. Front-load structure.
- Funnel, don't limit. Progressive tool gating works better than a hard request limit. The agent naturally transitions from exploration to deep-dive to output, rather than being cut off mid-investigation.
- Make the backend a strategy, not a hard dependency. The two-stage pipeline (explore → structure) decouples the exploration engine from the output format. Today it's Grok and Claude Code; tomorrow it could be any agent that can read files and write markdown.
- Save raw artifacts. The raw markdown from external agents is invaluable for debugging bad analyses. If the structured output looks wrong, the raw artifact tells you whether the problem was Stage 1 (bad exploration) or Stage 2 (bad extraction).
AppPulse is a personal project I keep iterating on. The code analysis pipeline is the part I'm most excited about — it's the difference between "you have 3 critical bugs" and "here's exactly where they are and what to change." If you're building something similar, the pluggable backend pattern and two-stage pipeline might save you some architecture headaches.